Showing posts with label ssb. Show all posts

Sunday, February 16, 2025

Mathematical Analysis of a two-tone SSB Signal

Suppose we have an SSB Transmitter tuned to transmit at carrier frequency \(f_c\), upper sideband. With an input audio modulating signal of \(f_a\), the transmitter generates an output signal of \( f_c + f_a\). For example if the tuned frequency is 7.0MHz and the audio input is 1kHz, a signal at 7.001MHz is generated.

Similarly, two input audio modulating signals \(f_a\) with amplitude a, and \(f_b\) with amplitude b, the transmitter generates a signal comprising two frequencies, one at \( f_c + f_a\)  and another at \( f_c + f_b\).

The following analysis shows that this 2-frequency output signal can be generated by amplitude-modulating an a single frequency-modulated oscillator. 

The following trigonometric identities are used:

(I): \( \cos(x+y) = \cos x\cos y - \sin x\sin y\) -- link

(II) \(x\cos\theta + y\sin\theta = c\cos(\theta+\phi)\) where \( c = sgn(x)\sqrt{(x^2+y^2)}\), \(\phi = \arctan(-y/x)\) -- link

(III) \( \sin^2x + \cos^2x = 1\) -- link

We start with the output signal:

\( s = a\cos 2\pi(f_c+f_a)t + b\cos 2\pi(f_c+f_b)\)

Define \( \omega_c = 2\pi f_c \),  \(\omega_a = 2\pi(f_c+f_a)\) and \(\omega_b = 2\pi(f_c+f_b)\):

\( s  = a\cos \omega_a t + b\cos \omega_b \)

\( s = a\cos \omega_a t + b\cos (\omega_a t + (\omega_b - \omega_a) t)\)

Applying (I): 

\( s = a\cos \omega_a t + b \cos \omega_a t \cos (\omega_b - \omega_a) t - b\sin\omega_a t \sin (\omega_b - \omega_a) t\)

Rearranging:

\( s = (a + b\cos (\omega_b - \omega_a) t) \cos\omega_a t  - b\sin\omega_a t \sin (\omega_b - \omega_a) t\)

Applying (II), with \(x = (a + b\cos (\omega_b - \omega_a) t)\), \(y = b\sin(\omega_b - \omega_a)t\):

\(s = \sqrt{a^2 + 2ab\cos(\omega_b - \omega_a) t + b^2\cos^2(\omega_b - \omega_a) t +  b^2\sin^2(\omega_b - \omega_a) t} \cos\left({\omega_a t  +\tan^{-1} \frac{b\sin(\omega_b - \omega_a) t}{a+b\cos(\omega_b - \omega_a) t}}\right)\)

Applying (III) to simplify the terms under the square root:

\(s = \sqrt{a^2 + 2ab\cos(\omega_b - \omega_a) t + b^2} \cos\left({\omega_a t  +\tan^{-1} \frac{b\sin(\omega_b - \omega_a) t}{a+b\cos(\omega_b - \omega_a) t}}\right)\)

This complex equation can be better understood by rewriting it as:

\(s = A \cos (\omega_a t  + f(t))\)

where:

  • \( A = \sqrt{a^2 + 2ab\cos(\omega_b - \omega_a) t + b^2} \) sets the amplitude of the generated signal, and varies slowly compared to the carrier frequency because \( \omega_b - \omega_a \ll \omega_c\), and
  • \( f(t) = \tan^{-1} \frac{b\sin(\omega_b - \omega_a) t}{a+b\cos(\omega_b - \omega_a) t} \) and varies slowly compared to the \(\omega_a t\) term, again because  \( \omega_b - \omega_a \ll \omega_c\).

In other words, combining two input signals results in an output signal with a phase varying around \(\omega_a t\) at the difference frequency \(\omega_b - \omega_a\) and with amplitude A also varying at the difference frequency.

Confidence that the formula is correctly derived can be gained by testing what happens if either of the modulating signals is removed (by setting it's amplitude term - either a or b - to zero. The formula should "collapse" to a single simple waveform. Indeed this is exactly what happens.

The analysis so far draws on "Frequency Analysis, Modulation and Noise", Standford Goldman, 1948 - p160. I believe what follows is novel.

Phase/Frequency Analysis

The full phase term is: \(\left({\omega_a t  +\tan^{-1} \frac{b\sin(\omega_b - \omega_a) t}{a+bcos(\omega_b - \omega_a) t}}\right)\).

The frequency at any instant in time is the derivative of this term with respect to time:

\( f = \frac{d}{dt}\left({\omega_a t  +\tan^{-1} \frac{b\sin(\omega_b - \omega_a) t}{a+b\cos(\omega_b - \omega_a) t}}\right)\)

\( f = \omega_a + \frac{d}{dt}\left({ \tan^{-1} \frac{b\sin(\omega_b - \omega_a) t}{a+b\cos(\omega_b - \omega_a) t}}\right)\)

Deriving the derivative of this second term is beyond my mathematics skills, but thankfully the Derivative Calculator website will do this for us (click the "Go!" button). Here I have defined \(m = \omega_b - \omega_a\).

The result is gives is: \(\frac{bm \left(a \cos\left(mt\right) + b\right)}{b \left(2a \cos\left(mt\right) + b\right) + a^{2}}\)

This formula isn't very informative, apart from showing that the output frequency varies with the difference frequency \(m = \omega_b - \omega_a\). However, very helpfully, Derivative Calculator also interactively plots the input and derivative values for the input values a, b and m. For example:


Experimenting with different values starts to give some slight intuition about how the amplitude values influence the frequency output. For instance, as the two amplitudes approach each other, the frquency variation grows dramatically:

Finally, when the two amplitudes are equal, there's a discontinuity & the "blip" disappears from the graph view - the negative "blip" is still there and corresponds to the negative edge of the input signal, but it's infinitely narrow and doesn't display:

This tendency for the frequency "blip" to grow without bound as one amplitude approaches the other is extremely important phenomena to understand in later analysis. It will also become apparent that this phenomena changes slightly when we move from the continuous domain to the discrete/sampled domain.

Note that the blue waveform might initially look strange when the amplitude is increased further:

The explanation for the discontinuities in the blue input waveform is that it is a phase measurement and has been displayed to wrap every \(2\pi\). The red derivative is displayed correctly and does not show any "blips" at these transitions.

Amplitude Analysis

The amplitude term is \( A = \sqrt{a^2 + 2ab\cos(\omega_b - \omega_a) t + b^2} \).

Its behaviour can be interactively plotted here.

The most interesting plot is again when \(a = b\):


This is a rectified sine wave, as can be demonstrated by setting \(a = b = 1\). The amplitude term simplifies to:

\( A = \sqrt{1 + 2\cos(\omega_b - \omega_a) t + 1} \)

\( A = \sqrt(2)\sqrt{1 + \cos(\omega_b - \omega_a) t } \)

But \(sgn(\cos\frac{\theta}{2})\sqrt{\frac{1 + \cos\theta}{2}}= \cos\frac{\theta}{2}\)  (see link).

So, ignoring the sign term, the amplitude is the shape of a cosine wave.

A rectified sine wave has high harmonic content (see here or here), which will become relevant in later analysis.

Conclusions

This mathematical analysis has derived some equations for both amplitude and frequency shift that appear to correspond to expectations.

The interactive waveform plots give some intuition on the signal behaviour. In particular, when the two tones approach the same amplitude, the frequency shift approaches a discontinuity and values can become very large, and the amplitude waveform approaches a shape that has high harmonic content.


Thursday, February 13, 2025

Measuring the Si5351 Output Frequency Settling Time

 I'm using the Si5351 programable clock generator in an upcoming project, portions of which are similar to the usdx. For my application, characteristics of the chip that are important, but not documented in the datasheet, are:

  • When does the output frequency change in relation to the I2C command that has been issued to update the frequency? Answer: on the second to last low-to-high I2C clock transition of the command that writes the lowest byte of the PLL register.
  • How long does the output frequency take to reach the target frequency (its settling time)? Answer: < 1us! Yes, it settles extremely quickly.

This note describes how I measured these characteristics.

For my tests, the Si5351's output frequency is being updated at up to 12k times per second. The I2C bus is overclocked at 800kHz to achieve this update rate. The usdx project implements a frequency-change mechanism where just 5 on-chip 8-bit register values are updated in a single I2S 7 byte transaction. The update is made to alter the PLL frequency. For the purposes of my tests I use the same mechanism, but only need to update 4 registers for the range of frequency changes I'm conducting. Documenting the exact frequency update mechanism is outside the scope of this note, but can be ascertained from the usdx code and reference to AN619.

Note that my tests also showed that the Si5351 output only changes when the lowest byte of 

Test Method

I used a mixer to compare the Si5351's output target frequency against a known reference frequency. The filtered mixer's output is the difference between the input frequencies. So when the two frequencies are the same, or very similar, the output is either constant or changes only slowly. I initially used a filter RC time constant of 1us.

The mixer was built from a 3253 analogue switch. The mixer is very much like a quarter of a Tayloe Mixer.

The fixed frequency could be provided by an external source, but in my case I used a second Si5351 output.  I have relied on the fact that the si5351 can be configured to output 2 frequencies completely independently - each with their own PLL and MultiSynth divider chain (a third output frequency can also be configured, but must share one of the PLLs):

  • the target frequency on CLK1 whose frequency will be adjusted by ±4kHz (or more).
  • the reference frequency on CLK2 whose frequency is locked and stable throughout a test.
A Pi Pico 2 was used for generating the I2C signals, and output a "high" on a digital pin just before the start of a I2C transaction, and "low" immedately after. An oscilloscope monitored the I2C clock, the digital pin, and the mixer output.


To conduct the measurement, the target frequency would first be set several kHz above or below the reference frequency and allowed to stabilise, and then the target frequency would be set to match the reference frequency.

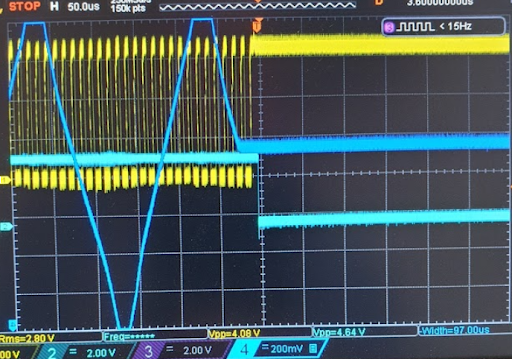
A typical trace (with the target frequency starting 5kHz above the target frequency, with C = 1nF & RC = 1us) is:

(where yellow = I2C clock, cyan = digital output, blue = mixer output).

The 5kHz difference frequency is clearly visible on the mixer output prior to the frequency change. The flat flat output after the frequency change shows that the target and reference frequencies are now equal.

Zooming in, we see that the mixer output becomes flat (ie target and reference frequencies now equal) within a few microseconds after the second to last low-to-high transition of the I2C clock. The 1us RC time constant of the filter slows the transition:

With C = 100pF, RC = 0.1us there is reduced filtering, but the exact time thta the frequency changed is much clearer:

The frequency transition occurs within 1us.

The tests were rerun using an external Function Generator as the reference frequency. The same results were obtained and verify that there was no unintentional interaction between the two Si5351 outputs.